|
Access to professional sport financial information is generally challenging since many organizations are privately owned. A few, however, are publicly owned or by a parent organization. Such is the case of the Atlanta Braves and Formula One, who are owned by Liberty Media Group. A such, their financial position can be generally obtained through the annual report.
In 2022, the Braves earned $588 million from all team generated revenues. This includes league and local derived revenue, along with real estate income. The operating expenses are substantial, as this includes the player salaries, leaving an EBITDA of $49 million. Once depreciation is entered, operating revenue is negative, as is net income, showing a loss of $35 million. The cash flow position when adding back depreciation, and making other adjustments, shows an increase in cash of $53 million. This can provide a general overview of the financial position of a baseball franchise. During the 2022 year, Formula 1 generated $2.5 billion in total revenue, or over 4x the revenue generated by a single franchise. Their cost of operations were $1.75 billion with sales, general and administrative cost adding an additional $288 million in expenses. This leaves an EBITDA of $535 million, a net income of $562 million with an overall cash flow increase of $534 million. Annual reports are a great way to get a glimpse in the annual activities of an organization, and sport is no different. The reports lack some of the specific lines that would be of interest, but they do provide a general overview of the operating environment of sport organizations.
0 Comments
The management of the sport revenue has evolved over time as consumption of sport has changed. Historically, the main driver of revenue was attendance and the ticket sales that provided. Now, however, the majority of revenue for elite sport is from broadcast partners. At the upper echelons of sport, from international competition, to prominent professional leagues to NCAA Division I athletics, the ability to distribute content via broadcasts is the dominant revenue driver. Since many sport federations, governing bodies and some organizations are non-profits, it is possible to collect financial information. Using this information can help understand the flow of money into elite sport. The chart organizes total revenue and the contribution made by broadcasting, corporate partnership and tickets. Since there is no standard for reporting, it is not possible to isolate contributions from each aspect for some organizations and they use different names when referring to similar sources. However, in aggregate a picture emerges whereby at least 50% of revenue comes in from broadcast partners. For the Packers, the national income is their distribution from NFL league generated revenue, which is dominated by broadcast and partnership contracts. Their 60/40 split of National to Local revenue is also a good rule of thumb for franchises in terms of their revenue. Larger markets will have a higher percent of local revenue, but smaller markets will have a lower percent of local revenue.
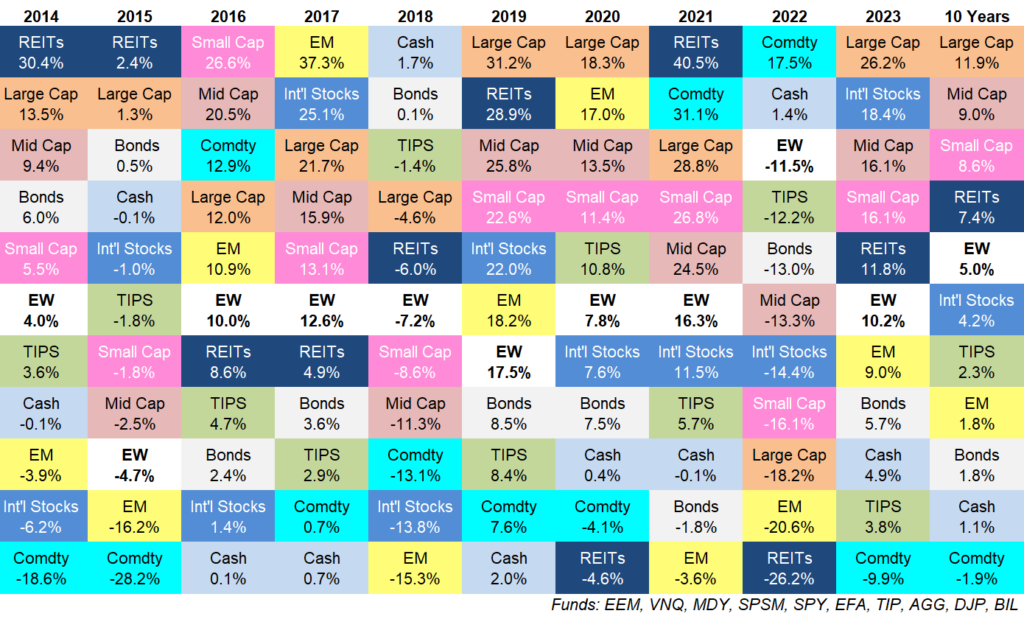
Since broadcasting is the business of sport, leagues monitor their viewership and distribution to their fans. As viewership, and popularity increases, so does the ability for rights holders to negotiate for higher contracts. As teams/leagues/federations create more content, they can negotiate for higher contracts. The entrance of additional partners (Apple, Amazon, etc.) increases the competition for content and can also lead to higher contracts. Understanding this landscape provides decision making opportunities when looking to grow a sport, reach fan segments, develop partnerships and create consumable content. ,A chart was released by the Federal Reserve, courtesy of Axios, that demonstrates the importance of investing to creating personal and generational wealth. The wealthiest 10% own 93% of all available shares. This is despite the total number of Americans who are invested and own shares has increased. For building long term wealth, investing is the answer. Most people will not end up on this chart, however, learning from the ultra rich provides a road map to wealth, and that map is share ownership. Whether that is through direct company shares or mutual funds, long term investing provides the avenue to wealth creation. A second chart shows the performance of different asset classes per year over the past decade. In any given year, the highest performing asset class may change, but there have been some trends. Investing in the largest companies (S & P 500) has had the highest return over the past decade. A diversified, equal weighted portfolio has been right in the middle, which is to be expected and cash is near the bottom. Holding cash typically has a negative real return as it does not appreciate in value and loses purchasing power due to inflation. To beat inflation, returns have to exceed that cost. This is where the investment decision comes in; where to allocate financial resources given risk tolerance, time horizon, expected returns, etc.
Working and consulting with a qualified financial advisor is helpful in answering those questions and determining what the best allocation is for every individual. These charts help with the questions to ask and where to put those resources to build wealth. |
AuthorI write on sport management, fitness, sports medicine and business topics to help you reach your goals Archives
February 2024
Categories
All
|
|
Home
About Contact |
To learn more about what services we offer, to schedule an appointment or to get prices please contact me at
[email protected] (607)279-6791 *This site is for educational purposes only, it is not meant to diagnose, treat or replace medical advice. Before starting an exercise program always make sure that you are healthy and able to do so safely.* |


 RSS Feed