
|
Peloton posted their quarterly filings in the beginning of February 2024 and their share price immediately dropped. Looking at the filing and it is easy to see why. Year over year, there as a $49.1 million decrease in total revenue, but the where the decrease came from is the interesting aspect. The connected fitness (hardware sales and subsequent memberships) decreased by 62.3 million, while the subscription revenue increased by 13.2 million. The cost of revenue is much higher for connected fitness, at almost 100% of the revenue it produces, whereas the cost of subscription is 33% of the revenue it generates. Since subscription revenue has capacity for scale (production costs are fixed) it would appear that this is the future of Peloton's business. Sales and marketing continue to be a large percentage of revenue, despite not having much to show in terms of new acquisitions. 
0 Comments
Access to professional sport financial information is generally challenging since many organizations are privately owned. A few, however, are publicly owned or by a parent organization. Such is the case of the Atlanta Braves and Formula One, who are owned by Liberty Media Group. A such, their financial position can be generally obtained through the annual report. In 2022, the Braves earned $588 million from all team generated revenues. This includes league and local derived revenue, along with real estate income. The operating expenses are substantial, as this includes the player salaries, leaving an EBITDA of $49 million. Once depreciation is entered, operating revenue is negative, as is net income, showing a loss of $35 million. The cash flow position when adding back depreciation, and making other adjustments, shows an increase in cash of $53 million. This can provide a general overview of the financial position of a baseball franchise. During the 2022 year, Formula 1 generated $2.5 billion in total revenue, or over 4x the revenue generated by a single franchise. Their cost of operations were $1.75 billion with sales, general and administrative cost adding an additional $288 million in expenses. This leaves an EBITDA of $535 million, a net income of $562 million with an overall cash flow increase of $534 million. Annual reports are a great way to get a glimpse in the annual activities of an organization, and sport is no different. The reports lack some of the specific lines that would be of interest, but they do provide a general overview of the operating environment of sport organizations.  The management of the sport revenue has evolved over time as consumption of sport has changed. Historically, the main driver of revenue was attendance and the ticket sales that provided. Now, however, the majority of revenue for elite sport is from broadcast partners. At the upper echelons of sport, from international competition, to prominent professional leagues to NCAA Division I athletics, the ability to distribute content via broadcasts is the dominant revenue driver. Since many sport federations, governing bodies and some organizations are non-profits, it is possible to collect financial information. Using this information can help understand the flow of money into elite sport. The chart organizes total revenue and the contribution made by broadcasting, corporate partnership and tickets. Since there is no standard for reporting, it is not possible to isolate contributions from each aspect for some organizations and they use different names when referring to similar sources. However, in aggregate a picture emerges whereby at least 50% of revenue comes in from broadcast partners. For the Packers, the national income is their distribution from NFL league generated revenue, which is dominated by broadcast and partnership contracts. Their 60/40 split of National to Local revenue is also a good rule of thumb for franchises in terms of their revenue. Larger markets will have a higher percent of local revenue, but smaller markets will have a lower percent of local revenue. Since broadcasting is the business of sport, leagues monitor their viewership and distribution to their fans. As viewership, and popularity increases, so does the ability for rights holders to negotiate for higher contracts. As teams/leagues/federations create more content, they can negotiate for higher contracts. The entrance of additional partners (Apple, Amazon, etc.) increases the competition for content and can also lead to higher contracts. Understanding this landscape provides decision making opportunities when looking to grow a sport, reach fan segments, develop partnerships and create consumable content.  ,A chart was released by the Federal Reserve, courtesy of Axios, that demonstrates the importance of investing to creating personal and generational wealth. 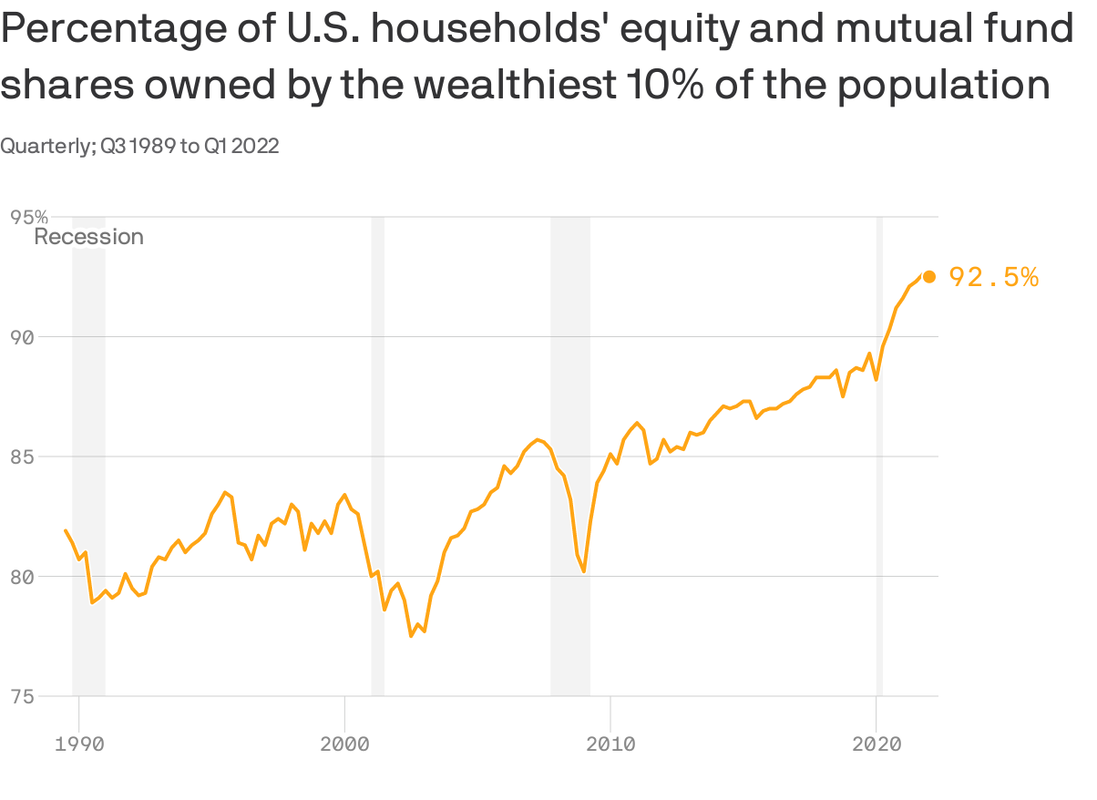 The wealthiest 10% own 93% of all available shares. This is despite the total number of Americans who are invested and own shares has increased. For building long term wealth, investing is the answer. Most people will not end up on this chart, however, learning from the ultra rich provides a road map to wealth, and that map is share ownership. Whether that is through direct company shares or mutual funds, long term investing provides the avenue to wealth creation. A second chart shows the performance of different asset classes per year over the past decade. 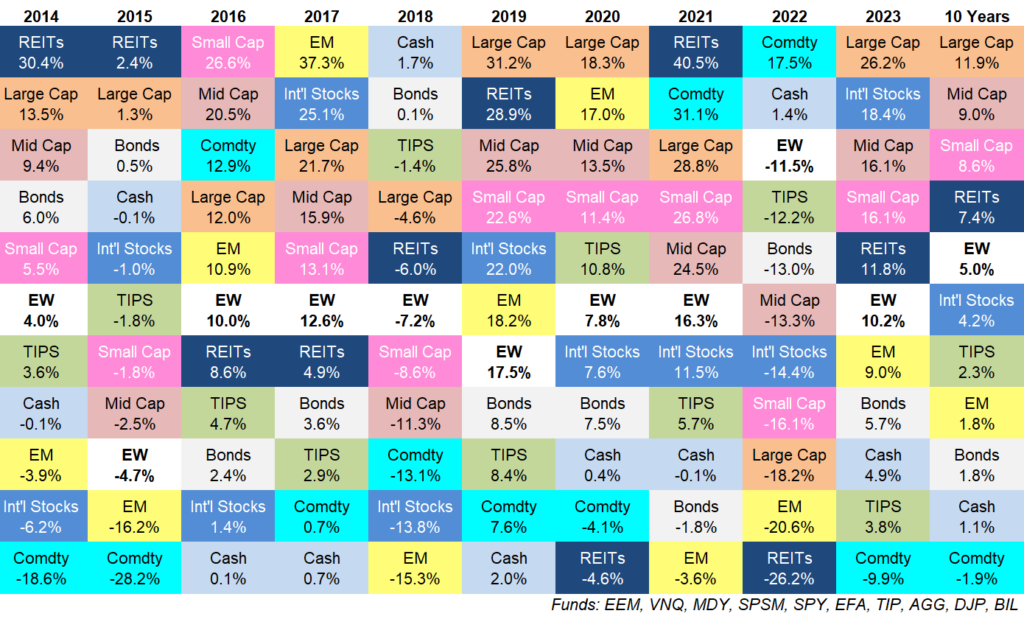 In any given year, the highest performing asset class may change, but there have been some trends. Investing in the largest companies (S & P 500) has had the highest return over the past decade. A diversified, equal weighted portfolio has been right in the middle, which is to be expected and cash is near the bottom. Holding cash typically has a negative real return as it does not appreciate in value and loses purchasing power due to inflation. To beat inflation, returns have to exceed that cost. This is where the investment decision comes in; where to allocate financial resources given risk tolerance, time horizon, expected returns, etc.
Working and consulting with a qualified financial advisor is helpful in answering those questions and determining what the best allocation is for every individual. These charts help with the questions to ask and where to put those resources to build wealth. In strategic management of sport organizations, students have been working on examining the competitive environment of fitness and Peloton, specifically. Using Peloton’s most recent annual report, a few interesting findings jump out: “We believe that our first-mover advantage, leading market position, brand recognition, and integrated platform set us apart in the market for connected, technology-enabled fitness. We provide a superior value proposition and benefit from the clear endorsement of our Connected Fitness Subscription and mobile app solutions, giving us a competitive advantage versus traditional fitness and wellness products and services, and future potential entrants.” (pg. 10) “While we believe we are changing the consumption patterns for fitness and growing the market, our main sources of competition include in-studio fitness classes, fitness clubs, at-home fitness equipment and content, and health and wellness apps.” (pg. 10) “Our Connected Fitness Products are sold in highly competitive markets with limited barriers to entry.” (pg 19) Peloton has 6.9 million members, a one million increase from the 5.9 million members the previous year. There are 2.1 members per paid subscription, resulting in approximately 3.5 million paid subscriptions. Revenue is comprised of connected fitness (selling hardware and the subsequent $44 monthly subscription) and subscriptions, which is a digital fitness membership costing $13 a month. There was $637.3 million in advertising costs 2022. This would make the cost of incremental acquisition $637 per member, and even higher per subscription. They have also built up $1.3B in finished product inventory. While the company stated that the connected fitness devices, and the sale of the bike, are vital to the company, and that it increased 27% from 2021, the revenue generated decreased 30%. This discrepancy in subscriptions is attributed to selling the product at a loss, as seen by the gross margins. Digital fitness subscriptions saw a 60% increase in revenue with a gross margin of 67%. While connected fitness costs are substantial, the margin of subscriptions is much more attractive, and growing, and would appear to be worthy of additional consideration. In fairness to Peloton, digital fitness competitor Beachbody is also not profitable or cash flow positive and Amazon discontinued their fitness platform, Halo. As stated in their report, the fitness industry has highly competitive industry, with low barriers to entry, high substitutes and strong buyer power, making it an unattractive industry segment.  The gross margin of digital fitness make that revenue segment a potential opportunity for growth. Since Peloton already has fixed costs associated with content creation, variable costs to increasing the number of digital fitness members would be small. Growing this sector of the business by positioning the organization as content creation and distribution and working to increase the digital membership base may provide an avenue to future profitability. Although, future management would also benefit from reducing operational costs.
There have been some recent changes to the collegiate conference landscape as universities are moving from one conference to another. When graphing out the average and median revenue that was generated by the football programs, the picture becomes more clear. 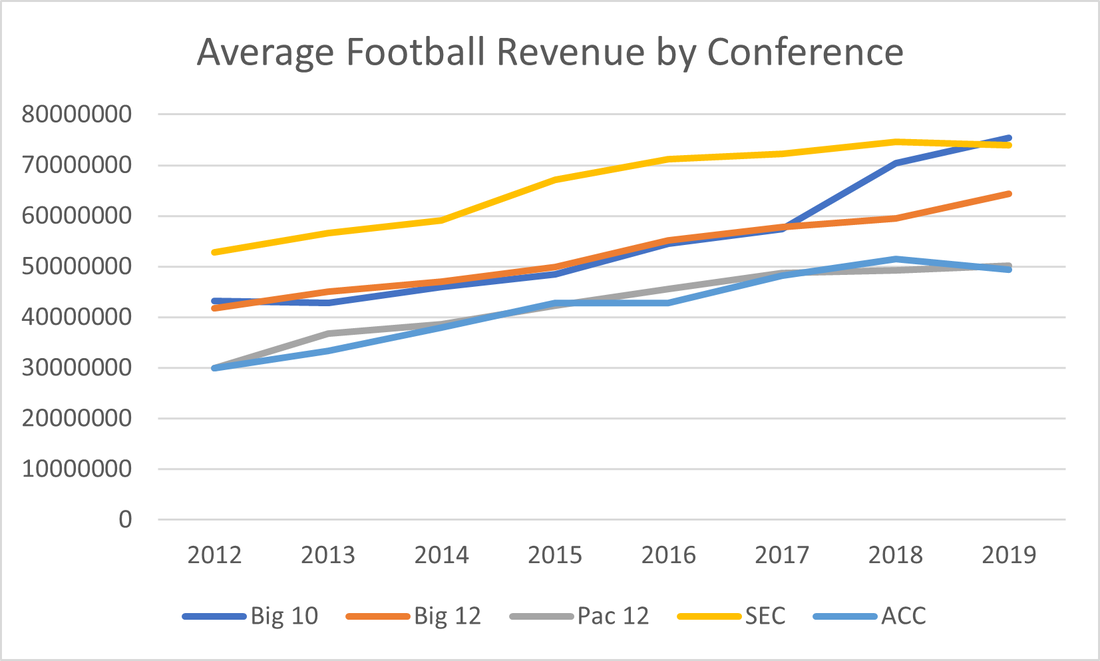 More revenue provides universities with more financial resources to spend on attracting athletes. Since, there are restrictions on athlete pay, revenue is allocated toward paying coaches, administrators and on facilities. With the SEC and Big10 dominating the revenue, the other conferences are at a visible financial disadvantage. The same picture emerges with median revenue by conference. 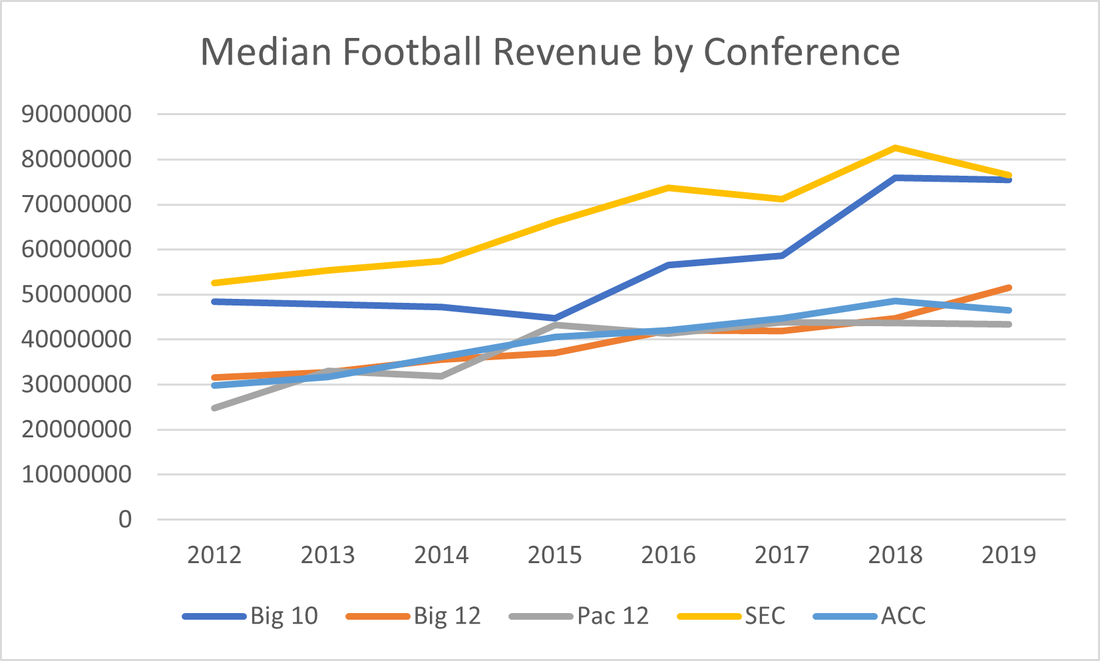 This financial disadvantage means that universities who are competitive in their conference are not receiving as much as they would from another conference. This provides an incentive for switching conference. It may also foretell the change from five power conferences to fewer as those financial resources become even more consolidated over time.
Leadership is a complex and dynamic process that seeks to gain influence over people. A lot of work has been done on leadership traits, behaviors, styles and their interrelationships. There are examples of great leaders from everywhere across the spectrum, with the constant that leadership is about people, and getting the most of them. Generally, transformational and servant seem to be two styles that work for different dynamics. In an effort to simplify, and visualize, the process, the leadership wheel focuses on four categories of leadership behavior: Setting expectations and standards, communication, providing support and resources and accountability. These for categories help to organize the leadership process and incorporate different inputs and themes into the process. The inputs include the dominant individual style and traits of the leader, follower preferences, education, skill and competence, the task environment and the objectives. The leader is also responsible for determining the future direction and the objectives to be obtained. With this information, the leader is then able to enter the leadership wheel to combine the inputs into a successful strategy to achieve desired outcomes. Setting Expectations and Standards This category is about the relationship between the inputs and the outcome. Determine the direction to move and the expectations to achieve it. This includes describing the standard and quality of the intended product and service, what is acceptable and what is not, what the values are and is an opportunity to use group input to create shared values and start the process for collective effort. Without defined expectations and objectives, it is hard to provide leadership toward the attainment of those expectations and objectives. Communication Once the expectations have been clarified, they need to be expressed by the leader so they are understood. One of the break downs in the leadership process is the lack of communication regarding the expectations and how they are to be achieved and what people are responsible for. This category is also an opportunity for the leader to listen and gather information. Since communication is a two-way street, leaders should listen more than they talk and look to provide clarity and clear up ambiguity. Provide Support and Resources Once the expectations are created and expressed, they can be actively pursued. Providing support and resources is not limited to creating a supportive work environment, but includes motivating and encouraging the organization to attain objectives. It is also the category where the leader provides education, skill development and training necessary to achieve the desired outcome. This category is about the behaviors that the leader is doing to support the achievement of objectives. If there is a lack of competency, training, understanding, time, finances, human capital necessary to achieve a goal, then its attainment is an unreasonable expectation. Leaders can empower their followers to take risks and provide the guidance needed to keep projects and work progressing toward the defined objectives. Maintain Accountability This category is where the leader is monitoring and evaluating the progress and providing encouragement, recognition, rewarding achievement and utilizing performance improvement plans to address issues. If there is not accountability, then it is almost impossible to maintain consistency of a standard of excellence. Goal attainment, exceeding expectations and greatness should be celebrated, while areas of opportunities should be addressed and improved. This category is where work and effort is recognized and where people leave if the standards and expectations have not been met, despite the opportunities to do so. 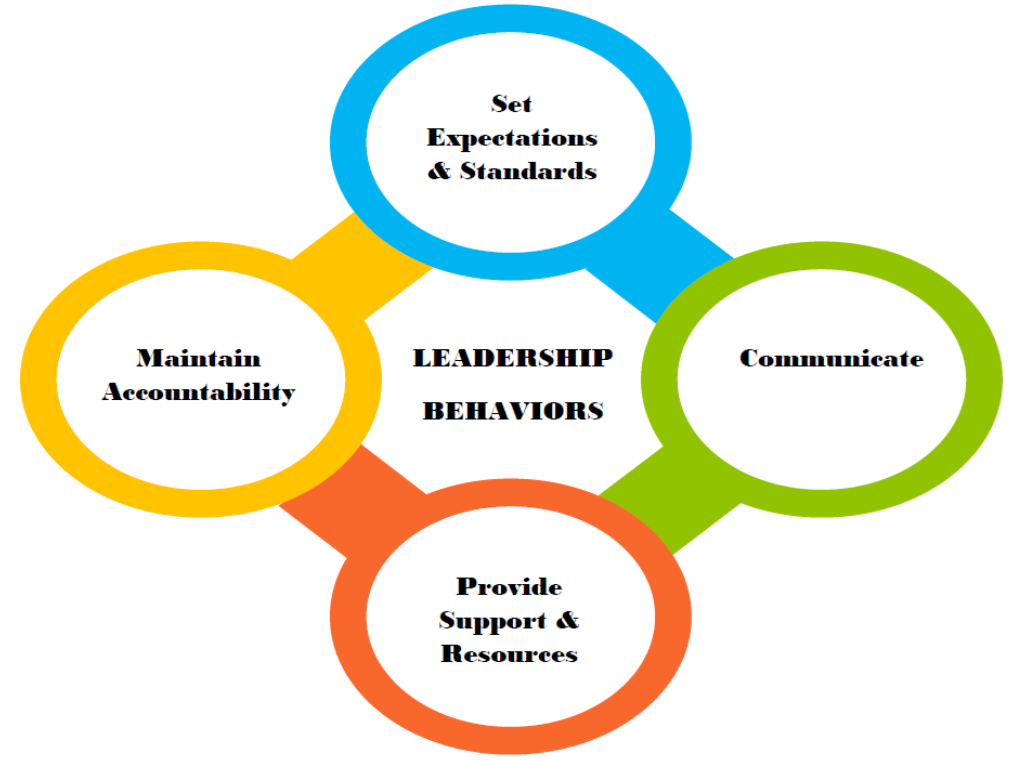 This is a continual process where leaders are maintaining focus on desired expectations and communicating those expectations. If expectations are not defined, are unreasonable or are not communicated then there is a breakdown and a failure of leadership. It is also necessary to create the environment to support the attainment of those objectives and to train everyone into how to meet the standard. If there is not training or skill progression, then there is a breakdown in leadership. Finally, accountability is for the leader and for others. If a leader is ineffective in the other categories then they should also be held accountable to their breakdown and failure in leadership. If the organization is not meeting outcomes despite their defined expectation, communication of success and provision of necessary resources, something has to change. Breakdowns are possible in every category throughout the process, but the process helps organize the effort necessary to reach objectives.
Using data from Forbes and SBRnet, the franchise valuations have steadily grown since 2010. The median franchise value shows how dominant the NFL is in terms of franchise value with the median team worth almost $4billion. This is well above the other sports. It also looks like the NBA has surpassed the MLB over the last couple of years. If fan interest continues, and broadcasting revenue follows, this trend will continue. The average value demonstrates the same trend, but is higher due to the influence of the largest market teams seeing substantial growth. These graphs also serve as the visual representation for the escalation in purchase price of franchises and the interest of Private Equity investors for minority ownership. As these values rise, and broadcasting increases, owners are able to capitalize on the possibility of a large return with minimal risk. The same is not true for other entities, the regional sports networks who broadcast in local markets have suffered from the rising cost of doing business. 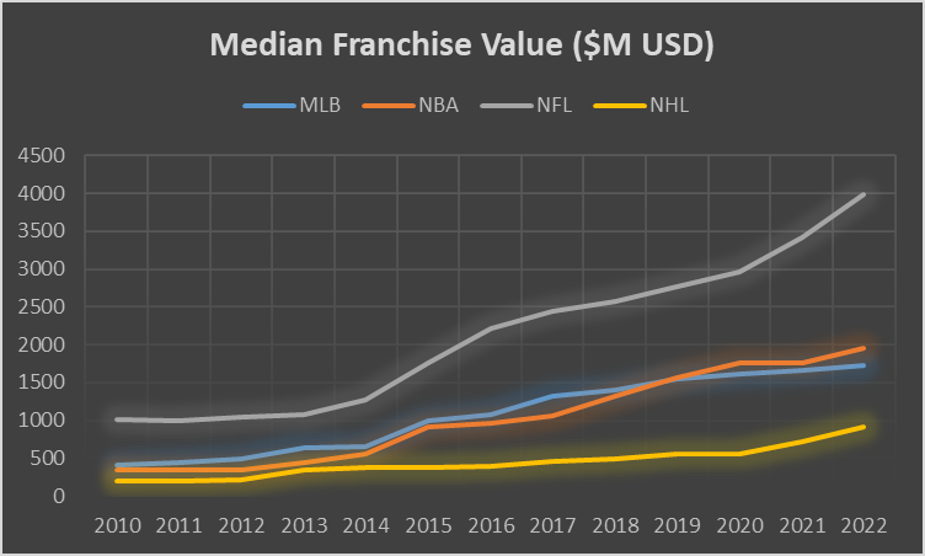 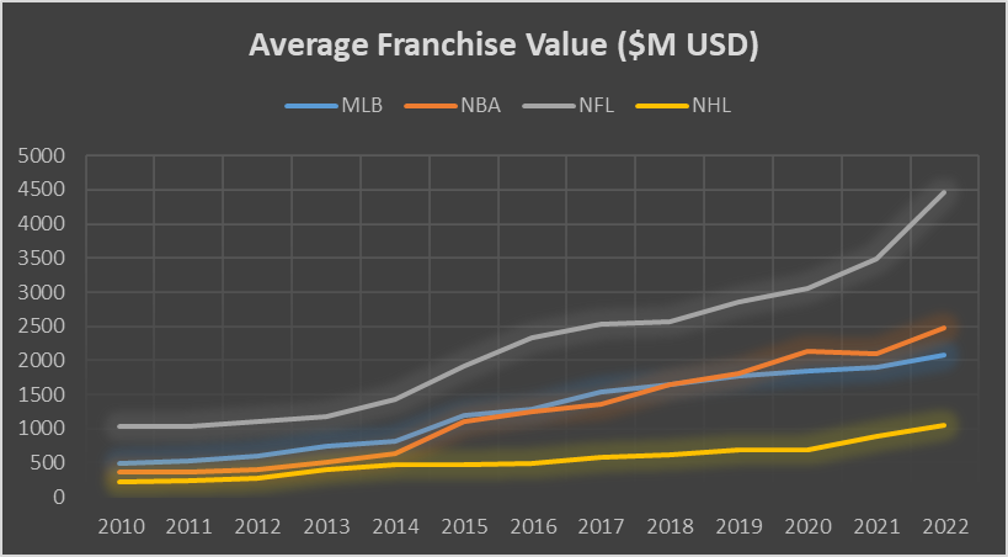
1Sport events are concerned with the benefits that they provide the community, and the economic benefits are often touted to support their hosting. Unfortunately, these economic impact estimates have a long history of controversy and inaccuracy in their reporting (Howard & Crompton, 1995). The main objective is to determine the net economic change that results from spending attributed to an event or facility. This net effect is the added benefit to that community that would not exist in the absence of the event (Brown, et. al., 2021). According to a prominent sport tourism organization, the two main rationales for bidding on, and hosting, sport events are economic impact and hotel room nights (SportsETA, 2021). Therefore, it is important to accurately assess the benefits that accrue to the host community as a result of hosting. Since successful hosting is dependent upon the resources available in the host community, ten drivers have been identified to assist communities in determining the best use of available resources (Agha & Taks, 2015). Individuals and communities should focus on maximizing the benefit drivers and avoiding the cost drivers. 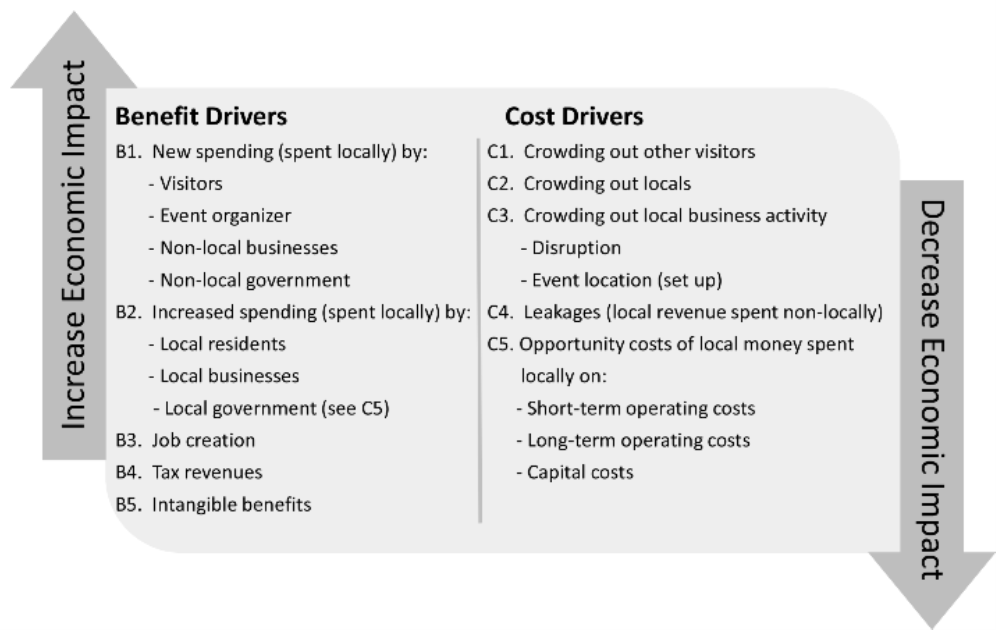 Since communities typically host more than one event, using a portfolio framework is an appropriate way to determine the mix of events based on the community resources and the myriad events and activities that occur in a typical year (Salgado-Barandela, Barajas, & Sanchez-Ferndandez, 2021). When using this portfolio framework, some factors for success include strategic planning for the hosting of multiple events, determining and communicating the benefits of hosting events to stakeholders, participation from stakeholders and inter-organizational relationships to improve collaboration synergies (Ziakis & Costa, 2011). 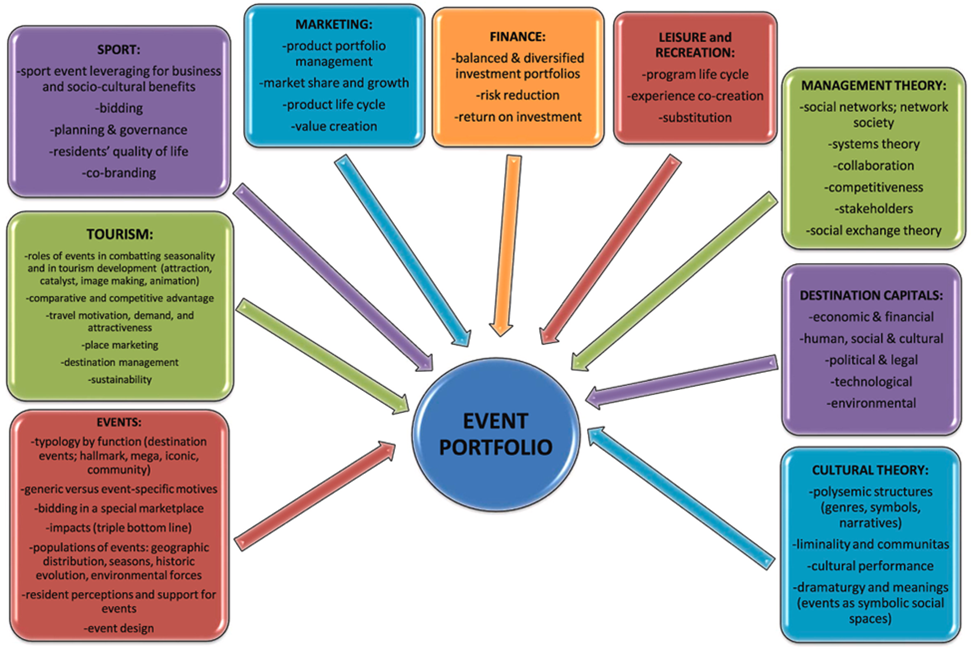 Given their importance, estimating the benefits is an important element in decision making and evaluation. Since the typical evaluation relies on isolating visitors to the area who would not have come in the absence of the event and their spending, this is the usual starting point for assessment. Typically, the event benefits are discussed, but the costs are excluded from assessment which artificially inflate the overall benefits. The costs have to be included in an assessment in order to determine the best use of the available resources. Some of the factors related to accuracy are outlined by Brown, et. al, 2021. 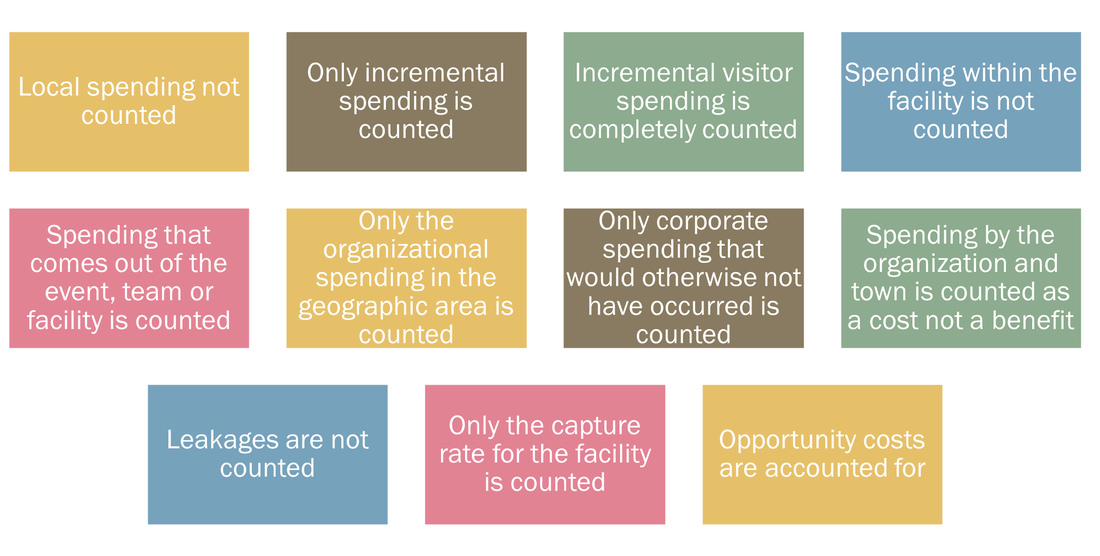 Utilizing this framework can assist communities, event organizers and others to host events that maximize the benefits to the area while being cognizant of the costs associated. Beneficial events are ones that rely on the existing resources (facilities, people, hotel capacity, restaurant capacity, recreation, etc) and align with the strategic goals of the community to optimize success. Hosting events can be a valuable addition to the community if the merits are properly assessed and the benefits and costs are evaluated.
References Agha, N., & Taks, M. (2015). A theoretical comparison of the economic impact of large and small events. International Journal of Sport Finance, 10(3), 199-216. Brown, M. T., Rascher, D. A., Nagel, M., & McEvory, C. D. (2021). Financial Management in the Sport Industry (3rd. Ed.). Routledge: New York, NY. Howard, D. R. & Crompton, J. L. (1995). Financing Sport. Fitness Information Technology, Inc: Morgantown, WV. SportsETA. (2021). Sports Events and Tourism: State of the Industry Report. Salgado-Barandela, J., Barajas, A., & Sanchez, Fernandez, P. (2021). Sport-event portfolios: An analysis of their ability to attract revenue from tourism. Tourism Economics, 27(3), 436-454. Ziakas, V. & Costa, C. A. (2011) Event portfolio and multi-purpose development: Establishing the conceptual grounds. Sport Management Review, 14(4), 409-423. Ziakis, V. & Getz, D. (2021). Event portfolio management: An emerging transdisciplinary field of theory and praxis. Tourism Management, 83, 1-15. When we discuss business, we most often use revenue streams to exemplify it. Where does the organization derive its revenue from? Who are the consumers and what sources of revenue exist? Understanding those questions allows those interested in sport business and management to better understand the business and decision making process in sport. What we learn about the business of sport is the importance of broadcasting and the impact this has on the operations of the organizations. If games are played, and broadcast, then this is the largest source of revenue to a rights holder. When looking to grow and expand a sport, it is vital to have a fan base that can be reached with broadcasting interest in order to generate the most revenue. We also see that organizations that are cavalier with borrowing money or are dominated by a single revenue stream are at greater financial risk. Sport managers need to understand the importance of diversification of revenue and the importance of cultivating an audience to achieve greater financial independence.
|
AuthorI write on sport management, fitness, sports medicine and business topics to help you reach your goals 
Archives
February 2024
Categories
All
|
||
 RSS Feed